Notes About Recycling Markets
Price volatility in recycling markets is a given. Managing revenue fluctuations can make or break a recycling program. Negotiating long-term contracts that feature price floors or other revenue/risk sharing agreements, and broadening markets by developing local manufacturing demand for recycled feedstocks can moderate revenue peaks and valleys.
Prices for all recycled materials tend to follow expansions and contractions in overall demand for manufactured goods. At the same time, specific trends in each industry — be it paper/paperboard, glass, steel, aluminum, or plastics — can push prices for different recycled materials in opposite directions. As a result, recycling programs that collect many different materials may experience less revenue volatility over the course of an economic cycle. However, even curbside recycling programs that collect a wide variety of materials, such as residential mixed paper, newspapers, cardboard, glass, metals, and plastic bottles, experience pronounced revenue swings. This is evident on the graph below, which gives the weighted average market price (large quantities packed for shipment to end-use manufacturers (F.O.B. processing facility) for materials collected by curbside programs in Washington State’s Puget Sound region.
(Click on the underlined graph title below to download a PDF.)
Average Price Curbside Recyclables
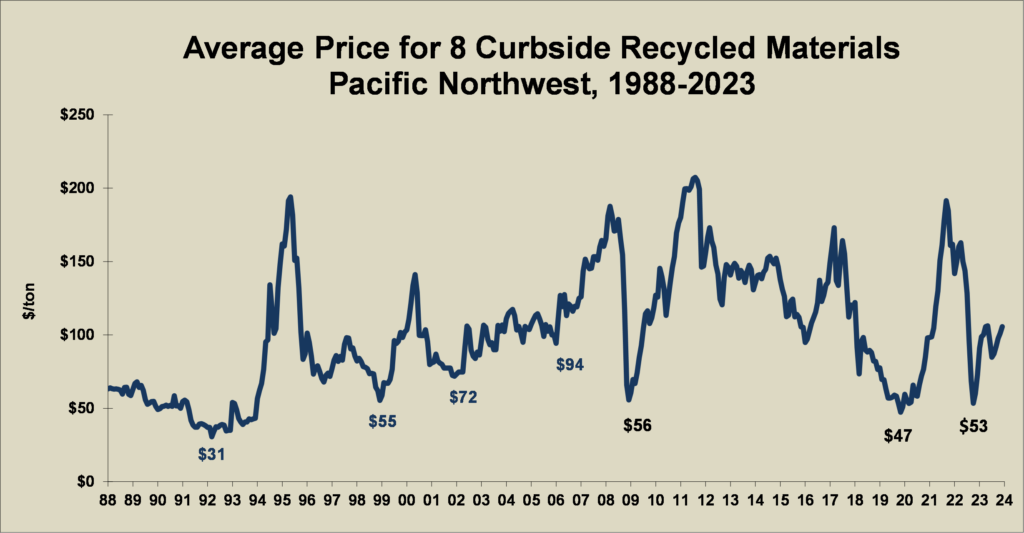
Underlying causes of some of the price movements shown on the graph include:
- Supply increases from new curbside recycling programs (late eighties – early nineties)
- General economic slowdown (late eighties – early nineties)
- Manufacturing feedstock inventory buildup in anticipation of shipping container shortages during the 1991 Persian Gulf War.
- Increases in recycled-content manufacturing capacity and demand especially in the paper industry (early to mid-nineties)
- Manufacturing feedstock inventory buildup in anticipation of continued price increases or supply shortages (1994-1995)
- Recession in Asian Economies (late nineties)
- Unanticipated inventory shortages at domestic and foreign paper mills – especially in China, Mexico, and Indonesia; Y2K fears; and substantial recovery for sales of many grades of paper and paperboard (1999 and early 2000)
- Generalized exuberance, dare we say “irrational”, in asset and commodity markets (mid-2006 through mid-2008)
- Financial markets crash in late 2008
- Gradual recovery back to normal trends beginning early-2009 through 2011
- Price decreases after 2011 due to contamination issues for curbside recyclables as collection programs continued switch to single stream, sharply increased scrutiny of quality by end users (especially China’s imposition of a “green fence” to reject poor quality materials produced by material recovery facilities in the US), and sharp decreases in oil and gas prices.
- Price increases beginning in 2016 and continuing through March 2017, even after adjusting for the changing mix of materials collected in residential curbside recycling programs. By March 2017 the average price was only $20 below the historic peaks in 1995 and 2011. It is important to note that the average prices portrayed on the graph do not adjust for changes in the value of the recycling market price dollar.
- General price decreases beginning in 2017 and continuing intermittently through 2018 and into 2019 due to China’s National Sword campaign to eliminate contaminants in recycled materials, especially in mixed paper and mixed plastics, imported into that country to be used in place of virgin raw materials in manufacturing consumer products and product packaging materials.
- General price increases during 2020, perhaps indicating recovery from the market impacts of China’s Green Fence and National Sword campaigns.
The seven prices under the graph’s trend line show average values during the down sides of price cycles. Prices during cyclical bottoms trended up from the early 1990s until the 2008 financial markets meltdown, and then seemed to continue that up-trend during the economic recovery immediately after the crash. This trend suggested that the downside price risk to recyclers was falling. However, this up-trend for cyclical price bottoms appears to have vanished in the wake of China’s Green Fence and National Sword campaigns.
In addition, besides recycled material quality issues and China’s Green Fence and National Sword campaigns, falling energy prices and other factors have impacted recycling prices throughout 2018 and reversed the up-trend of the previous 20 years. Material quality and energy prices affect the ability of recycled materials to compete with virgin raw materials. The typically much lower energy requirement for manufacturing new products out of recycled materials offers less advantage for a manufacturer’s bottom line when energy is cheap, especially when the quality of recycled materials may have declined. The average price for recycled materials in May and June of 2019 dropped to 35-year historic lows.
SRMG’s Recycling Markets Price Histories
To help you track and anticipate price trends for recycled materials (mixed paper, newspaper, cardboard, glass containers, aluminum cans, tin-plated steel cans, PET bottles, and HDPE bottles), Sound Resource Management Group (SRMG) provides price history graphs (twenty to nearly thirty years of monthly prices depending on material) for large quantities packed for shipment to end-users (F.O.B. processing facilities). Price data are provided for the Northwest US in a series of graphs on the Northwest Price Histories page. Graphs comparing virgin and recycled prices, energy use and carbon emissions for virgin- versus recycled-content product manufacturing, and carbon footprints for fuels used to generate electricity including wood wastes and municipal solid wastes (aka, garbage), are also available on the Virgin vs. Recycled page.