The Consumer Environmental Index (CEI™) tracks the environmental impacts caused by the production, use and disposal of the goods and services we consume each day. As we consume products and services, each person is responsible for his or her own pollution footprint and could be asking the question is my footprint growing or shrinking?
The CEI™ is an index like the Consumer Price Index (CPI), except that the CEI™ tracks environmental impacts rather than prices, and encompasses all retail purchases rather than just a fixed subset of product purchases. Our initial version of the CEI™ covers the environmental impacts of consumer choices on climate change, public health (respiratory disease, cancer, and toxicity), and ecosystems toxicity. The CEI™ should go down when there are decreases in the toxics substances, wastes, and/or pollution associated with consumption of goods and services.
The CEI™ is based on economic life cycle relationships combined with actual consumer spending patterns. It calculates the waste and environmental impacts caused by the production, use, and disposal of goods and services purchased each year by consumers.
Because it tracks the environmental impacts of purchases, the CEI™ can also be used by governmental agencies or businesses to guide efforts at reducing their environmental footprints and moving towards sustainability.
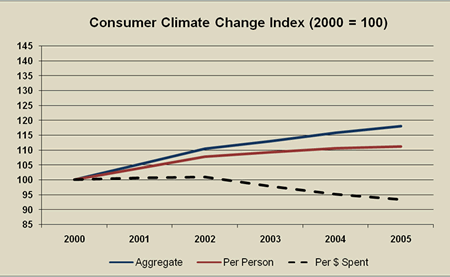
The following graph shows the climate change component of the CEI™ for the case study of Washington State consumers over 2000 through 2005. The chart indicates the increasing climate impact from more consumers spending more each year on products and services. The hopeful trend shown on the graph is that products and services Washington’s consumers are buying are shifting toward items that have lower greenhouse gas emissions on average for each dollar of spending.
(Click on the image below to see a larger graph.)
Source: J. Morris & H.S. Matthews, Development of a Consumer Enviornmental Index &
Results for Washington State Consumers, Journal of Industrial Ecology,
2010, 14(3) 399-421.
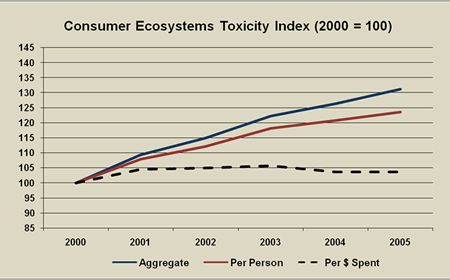
At the same time as there is this hopeful trend on climate change the trends for other environmental impacts are not so good. For example, the following graph shows the ecosystems toxicity component of the CEI™ for Washington State consumers. Impacts per dollar of spending for consumer purchases are not trending down for ecosystems toxicity as they are for climate change impacts.
(Click on the image below to see a larger graph.)
Source: J. Morris & H.S. Matthews, Development of a Consumer Enviornmental Index &
Results for Washington State Consumers, Journal of Industrial Ecology, 2010, 14(3) 399-421
The Washington State Department of Ecology has updated the CEI through 2007. The updated graphs are available at the links given below. In addition, the Department of Ecology is currently updating the CEI through 2010. This latest update will reflect the most current updates in Carnegie Mellon University’s Economic Input-Output Life Cycle Assessment (EIO-LCA) model, EPA’s Tool for the Reduction and Assessment of Chemical and Other Environmental Impacts (TRACI), EPA’s Waste Reduction Model (WARM), and Sound Resource Management Group’s Measuring Environmental Benefits Calculator (MEBCalc™).
Related Links:
Washington State Department of Ecology
http://www.ecy.wa.gov/beyondwaste/bwprogMeasure.html
http://www.ecy.wa.gov/beyondwaste/bwprogMRW.html
http://www.ecy.wa.gov/beyondwaste/pdf/CEI_Background_4-23-12.pdf
Carnegie Mellon University, Green Design Institute
Institute for Prospective Technological Studies
ec.europa.eu/environment/ipp/pdf/eipro_report.pdf
The Story of Stuff by Annie Leonard


